US stocks were on a roller coaster ride last week. The S&P 500 Index fell sharply the previous Monday morning, recovered some of its losses by close on Tuesday, dropped even further Wednesday, then climbed back up Thursday, before finishing down by 4.3% on Friday and 15% lower for its worst one-week decline since 2008. The S&P 500 has lost roughly 30% from its February 19 peak.
It’s clear, at least for the time being, that this type of substantial volatility is part of the new normal for investors: A new normal filled with uncertainty about the scope of the COVID-19 crisis and our response to it, with unemployment filings skyrocketing to possibly the highest levels on record, and a social restructuring of how we work, shop, go to school, and take care of our families.
As the financial media focuses on the shrinking American economy and the daily and weekly fluctuations of the S&P, Dow Jones Industrial Average (DJIA), and NASDAQ indexes, we continue to take the long view and remember that while markets are designed to handle uncertainty, to reassess expectations for the future in real time, and to price-in risk, they tend to have a habit of behaving unpredictably in the short run.
Let’s take a look at a recent period of the market’s performance.

Past performance may not be indicative of future results. Indexes are not available for direct investment.
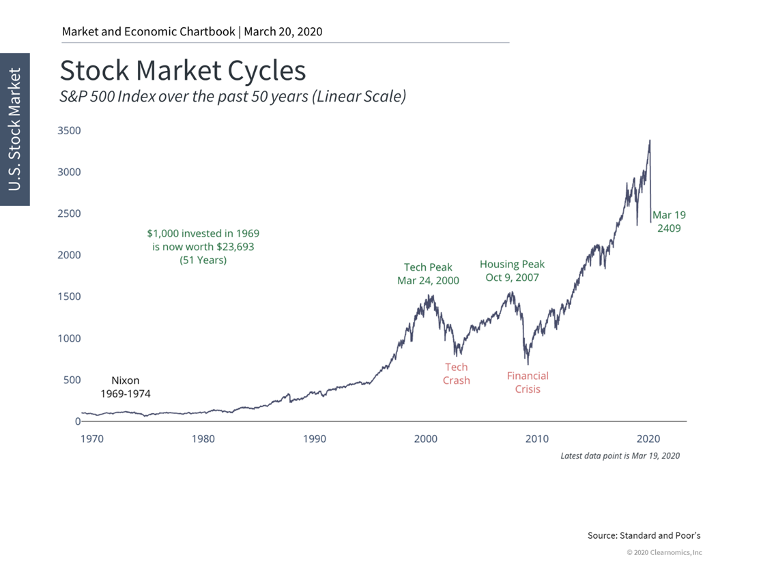
We see that the past few years have not been devoid of market pullbacks or volatility. If you removed the Y-axis and zoomed in, the ups-and-downs of short-term volatility would look even flatter. But as long-term investors, “zooming in” on a particular date or time period in the market’s history is the wrong approach. Here is the eagle-eye view of the market’s performance over the past 60 years.
Past performance may not be indicative of future results. Indexes are not available for direct investment.
Most recently, in 2008, the stock market was nearly halved in value. At the height of the Great Recession, it was likely pretty difficult to foresee a full recovery that would transform into an 11-year bull market. That doesn’t mean it was a smooth ride — after all, volatility is a completely normal part of investing.

Past performance may not be indicative of future results. Indexes are not available for direct investment.
Since 1980, the average year’s market performance experienced large intra-year declines while growing overall:
• The average year saw a stock market drop of -13.5%.
• Despite that, most years still ended in positive territory, averaging 9% gains.
When pundits and talking heads discuss market pullbacks, corrections, and recessions, they rarely give context for the inverse. “When’s the last time this happened?” is the wrong question to ask; rather, we should ask, “How have the markets typically responded to these events throughout history?” That’s not to speculate that we know or can guess how the current COVID-19 crisis will unfold, but as we mentioned in our last letter, we’ve gone through unprecedented crises in the modern era — the dot-com crash, 9/11, and the 2008 financial crisis among them.
We will not know the true economic and market impact of the COVID-19 crisis for some time. Historically, though, we’ve experienced two dozen stock market corrections since World War II, with the average correction taking the market down -14.3% from peak to trough and the average recovery taking only four months.

Past performance may not be indicative of future results. Indexes are not available for direct investment.
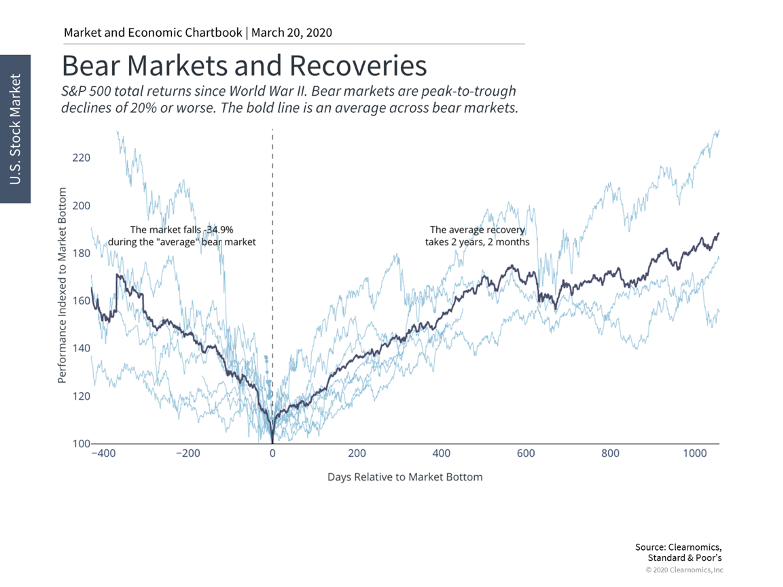
Meanwhile, if performance does remain in pullback territory (drops of 20% or worse), we can see that the average bear market experiences a drop of -35.8% from peak to trough, with the average recovery taking a little more than two years.
Past performance may not be indicative of future results. Indexes are not available for direct investment.
There are investors out there who hear the financial media or the political spin and want to react immediately. They will feel the urge to “wait for the bottom” or the start of a recovery. But timing the market doesn’t work. Here’s what it looks like to hypothetically miss the best market days over the past 25 years, using the S&P 500 Index as a baseline.

Past performance may not be indicative of future results. Indexes are not available for direct investment.
So, What Can We Control?
We know that timing the market doesn’t work, and that we can’t possibly predict what the future holds. We don’t know for certain how long the COVID-19 crisis will last, and we don’t know how the market will react to negative — or positive — news that arises from it.
Emotions are high, anxiety is prevalent, fear is palpable — these are all normal feelings. But there is a solution to ease the mental toll of the unknown, especially when it comes to your financial picture. Remember that the following factors are within your control:
Fees and Trading Costs: Excessive trading and turnover can result in hefty fees that could have a major impact on your ability to sustain long-term investment growth — growth that is necessary to achieving your goals, whether that’s living comfortably in retirement or funding a college education for your children. So, when you are tempted to move in and out of positions to try and capture the elusive “alpha,” just don’t do it; the costs outweigh the potential short-term reward.
Expense Ratios: You likely already know that mutual funds and exchange-traded funds (ETFs) come with a wide variety of costs, which affect the net return on your investment. The expense ratio is one of those costs, and it can give you a very clear idea of what you can expect to pay for an investment strategy. It’s crucial that you pay attention to these costs regularly, as even the smallest increase can actually have a significant impact on your investment growth over time.
Tax-Loss Harvesting and Rebalancing: Tax-loss harvesting is the silver lining of market volatility. Working in tandem with your financial or investment advisor, you can “harvest” investments to sell at a loss, and then use that loss to lower your tax bill for the gains you accrued over the course of the year. This is also the perfect time to rebalance your portfolio back to your target allocation or desired level of risk. Both of these strategies are proactive and will help you work toward the goals that are outlined in your financial plan, regardless of what’s happening in the markets.
Outside of your investment portfolio, you can also retain control over your financial life by choosing to partner with a fee-only, fiduciary financial advisor who prioritizes the importance of financial planning as part of a comprehensive wealth management strategy. Remember that you are investing for goals that are 10, 20, and 30 years into the future. Long-term investors don’t preoccupy themselves with short-term market movements because they know that they can rely on time-tested principles. These principles — coupled with staples like ample diversification and an asset allocation that reflects your risk tolerance and time horizon — will help you achieve a rewarding investment experience, even if it feels like the world around you is uncertain.
Moving on From the Markets: What’s Happening on the Policy Front?
The federal government is working around the clock to help stem the tide of financial panic caused by the COVID-19 crisis. Here is a brief overview of the political and policy responses we saw last week:
The Stimulus Bill
Last Wednesday, President Trump signed into law “phase two” of the COVID-19 stimulus package, which provides free testing for everyone (including the uninsured), expands unemployment benefits, and provides two weeks of emergency paid sick leave for many workers who are being tested or treated for the virus.
On Friday, “phase three” of the stimulus package was introduced to the Senate by Senate Majority Leader Mitch McConnell. The package, which is estimated to top $1 trillion, would give $1,200 to most individuals who made less than $75,000 in adjusted gross income (AGI) on their 2018 tax returns, or $2,400 for any married couple who made less than a combined $150,000 in AGI. An additional $500 would be included for every child within a family. These payments gradually would scale down for individuals with an AGI between $75,000 and $99,000. Individuals who earn more than $99,000 and married couples who earn more than $198,000 would not be eligible for any direct assistance.
McConnell says that these direct payments “would provide some extra certainty in this uniquely uncertain time.” The package would also provide industry-specific bailouts — $50 billion in loans for airlines, $8 billion for cargo air carriers, and $150 billion for hotels, casinos, and other large businesses. It would also provide $300 billion in loans for small businesses.
The proposed package currently faces opposition from both Congressional Republicans and Democrats.
IRS Tax Deadline Extended
After previously announcing that the tax-filing deadline for 2019 returns would not be extended, Treasury Secretary Steven Mnuchin reversed course last Friday and announced that the filing date would be pushed back 90 days — from April 15 to July 15.
The move, which applies to all individuals and corporations, is good news for those who traditionally owe money, allowing them to retain additional liquidity for the next several months.
Secretary Mnuchin is encouraging “all taxpayers who may have tax refunds to file now to get your money.”
Federal Reserve Rate Cut
Last week, the Federal Reserve slashed interest rates by a full percentage point — the largest in Fed history. This reduction, which is intended to entice borrowers and jump-start spending, puts the rate somewhere between 0% and 0.25%.
Key Personal Takeaways
During this time period, it’s important to practice caution and due diligence when seeking help or support networks, as these types of conditions unfortunately bring out people who may not be acting with the best intentions. Watch out for so-called “advisors” who are selling or pushing products that guarantee protection against market volatility or have a history of high fees (think structured notes or hedge funds), as these claims are often too good to be true. If you are looking for a financial advisor for the first time during this climate, rely on trusted resources such as the National Association of Personal Financial Advisors (NAPFA) or Financial Planning Association (FPA) databases, which can help you find reputable advisors who are also fiduciaries.
Coronavirus-related scams are also on the rise right now, with many identity thieves, phishers, and other fraudsters looking to capitalize on the panic and fear surrounding the pandemic. Last week, the Better Business Bureau® notified consumers of a text message scam that has recently cropped up, in which the texter sends a malicious link offering money for groceries. The link draws users to a website that can steal their email address, password and credit card number, among other sensitive data.
Other states like Nevada have received reports of thieves visiting people’s homes to offer fake at-home test kits and even cleaning products claiming to expunge COVID-19.
Be extra vigilant and wary of any recommendation that has not been verified by the CDC or the WHO. A healthy dose of skepticism can go a long way toward protecting you and your loved ones.
What We Can Do to Flatten the Curve
Beyond the market impact and policy decisions, it’s important to recognize the real, human cost that this pandemic is causing to our neighbors domestic and abroad. We must continue to prioritize the health and safety of our families, friends, loved ones, and community members by practicing social distancing and following the guidelines laid out by the CDC and WHO.
We can assume that there will be periods of volatility moving forward and that more changes are in store on the economic and policy fronts. We are committed to updating you on the factors that impact you and your clients’ day-to-day life and financial situations. If you have any questions or simply would like to discuss some of your concerns about our current environment, please contact us.
The foregoing content reflects the opinions of Equita Financial Network, Inc. and is subject to change at any time without notice. Content provided herein is for informational purposes only and should not be used or construed as investment advice or a recommendation regarding the purchase or sale of any security. There is no guarantee that the statements, opinions or forecasts provided herein will prove to be correct. Past performance may not be indicative of future results. Indexes are not available for direct investment. Securities investing involves risk, including the potential for loss of principal. There is no assurance that any investment plan or strategy will be successful, or that markets will recover or react as they have in the past.
The S&P 500 is a market capitalization-weighted index that tracks the 500 largest companies listed on the New York Stock Exchange or NASDAQ Composite. It is used as a benchmark of the overall stock market’s performance.
Return data represent past performance and are not indicative of future results. Historical performance does not reflect applicable transaction, management or other applicable fees as noted, the incurrence of which would decrease hypothetical, historical returns.
Source for all charts and text contained within graphics: © 2020 Clearnomics, Inc. All Rights Reserved. The information contained herein is proprietary to Clearnomics and/or its content providers and may not be copied or distributed. The information contained herein has been obtained from sources believed to be reliable, but is not necessarily complete and its accuracy cannot be guaranteed. No representation or warranty, express or implied, is made as to the fairness, accuracy, completeness or correctness of the information and opinions contained herein. All reports, charts and graphics compiled by Clearnomics or any of its affiliated websites, applications or services are issued without regard to the specific investment objectives, financial situation, or particular needs of any specific recipient and any commentary for any and all markets should not be construed as a recommendation to buy, sell or hold any security – including mutual funds, exchange traded funds or company stock.